

TLDR; Monitor Nginx Connections ด้วย Prometheus และแสดงกราฟด้วย Grafana
ขี้เกียจเขียนเยอะ เอาสั้นๆพอ
Prometheus คือตัว ระบบมอนิเตอร์ และ Time Series Database มันจะไปดูดสิ่งที่เรียกว่า Metrics มาเก็บไว้ที่ตัวมัน ทุกๆ x วินาที ตั้งได้
เอารูปไปดู 1 รูปพอ

เราอยากรู้ข้อมูลอะไร เราก็เอาโปรแกรมไปรันสำหรับสร้าง Metrics เช่น node_exporter ที่มีในเว็บของ Prometheus เองก็เอาไว้ส่ง Metrics ของเครื่องนั้นๆ เช่น Disk, RAM, Network
อีกอย่างที่ต้องรันคือ Prometheus มันเป็นไบนารีมาให้รันเลย เขียนคอนฟิกเพิ่มนิดหน่อย เพื่อบอกว่า ไปดูด Metrics จากที่ไหนบ้างมาเก็บ
จริงๆตัว Prometheus มันมีระบบสร้างกราฟให้แหละ แต่ไม่เท่ ใช้ Grafana cool กว่า
จะไม่ทำ How to ที่ละเอียด เพราะขี้เกียจ ผมจะมโนว่า ทุกคนที่อ่าน ใช้ OpenResty เป็นแล้ว
ใช้ Nginx Prometheus Metrics วิธีการคือ โหลดไฟล์ หรือโคลนมันมาเก็บไว้ จากนั้นเพิ่มคอนฟิกใน nginx ให้รู้จัก package.path แบบนี้ เขียนไว้ใน http context น่ะ นอก server context
ดูไฟล์ nginx.conf ก่อน
worker_processes  1;

events {
    worker_connections  1024;
}

http {
    #include       mime.types;
    default_type  text/html;

    sendfile        on;
    keepalive_timeout  65;

    server {
        listen       80;
        server_name  localhost;

        location / {
            content_by_lua_block {
                ngx.say("hello world")
            }
        }
    }
    include *.vhost;
}
เชี้ยย ก๊อปมายาวเลย มันจะมี *.vhost เอาไฟล์ไว้ข้างๆ nginx.conf เดี๋ยวมันจะหากันไม่เจอ แล้วดูไฟล์ metrics.vhost 2 บรรทัดบนก่อน เดี๋ยวค่อยแยกมาดู
lua_shared_dict prometheus_metrics 10M;
lua_package_path '/usr/local/openresty/luajit/lib/?.lua;;';
...
lua_shared_dict prometheus_metrics 10M; อันนี้คือ Shared dict ที่ไว้ให้ Lua เอาไปเก็บค่าต่างๆ ต้องเขียนไว้ใน nginx config file ด้วย ส่วน lua_package_path คือบอกว่า lua library ไปหาได้จากที่ไหนบ้าง เอาไฟล์จาก repo ข้างบนไปใส่ตามในนี้ /usr/local/openresty/luajit/lib/
กลับมาดูไฟล์ metrics.vhost ต่อ ผมจะข้าม init_by_lua_block, log_by_lua_block ไปลอกมาใส่ หรือ เอาไฟล์มาใช้เลย ก๊อปๆมา (บาปส์) มาดูส่วนของ server เลยส่วนนี้คือการสร้าง virtual host สำหรับให้ Prometheus มาดูด metics ไปเก็บ โดยเปิดพอร์ท 9527 ไว้
server {
    listen 9527;
    #allow 192.168.0.0/16;
    #deny all;
    location /metrics {
        content_by_lua_block {
            if ngx.var.connections_active ~= nil then
                http_connections:set(ngx.var.connections_active, {"active"})
                http_connections:set(ngx.var.connections_reading, {"reading"})
                http_connections:set(ngx.var.connections_waiting, {"waiting"})
                http_connections:set(ngx.var.connections_writing, {"writing"})
            end
            prometheus:collect()
        }
    }
}
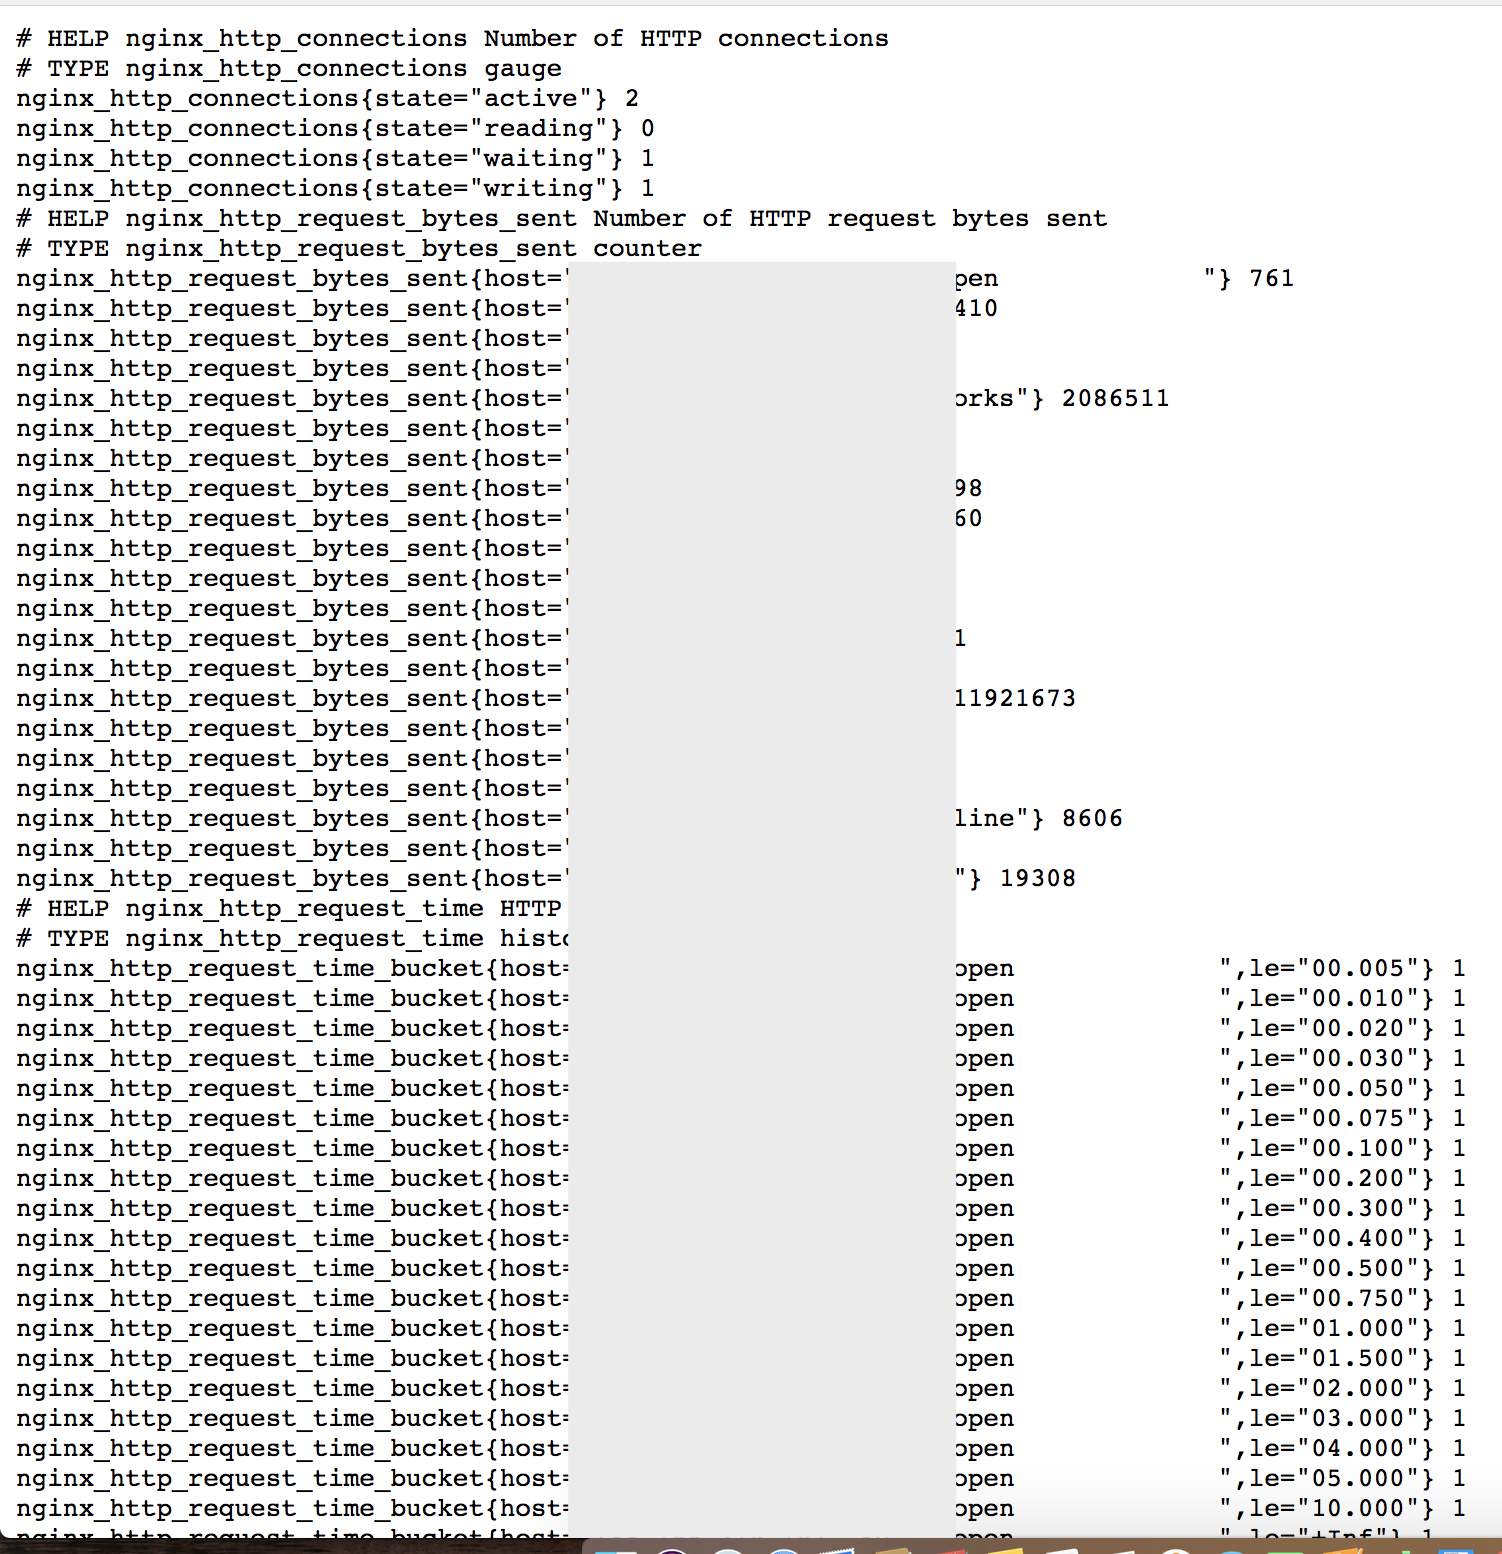
เมื่อใส่ไฟล์ครบแล้ว reload nginx แล้วเปิดไปที่ IP:9527/metrics จะได้ข้อความหน้าตาแบบนี้
ต่อมาให้รัน Prometheus โดยไปเลือกดาวน์โหลดได้จากที่นี่ https://prometheus.io/download/ เลือก prometheus-2.x.-ARCH.tar.gz ตามแพลตฟอร์มที่ใช้ แล้วแตกไฟล์มา ให้แก้ไฟล์ prometheus.yml แล้วเพิ่ม targets ไปยัง IP:9527 ที่รัน OpenResty ไว้
# ข้าม
scrape_configs:
  # The job name is added as a label `job=<job_name>` to any timeseries scraped from this config.
  - job_name: 'prometheus'

    # metrics_path defaults to '/metrics'
    # scheme defaults to 'http'.

    static_configs:
      - targets: ['localhost:9090']
      - targets: ['IP:9527']
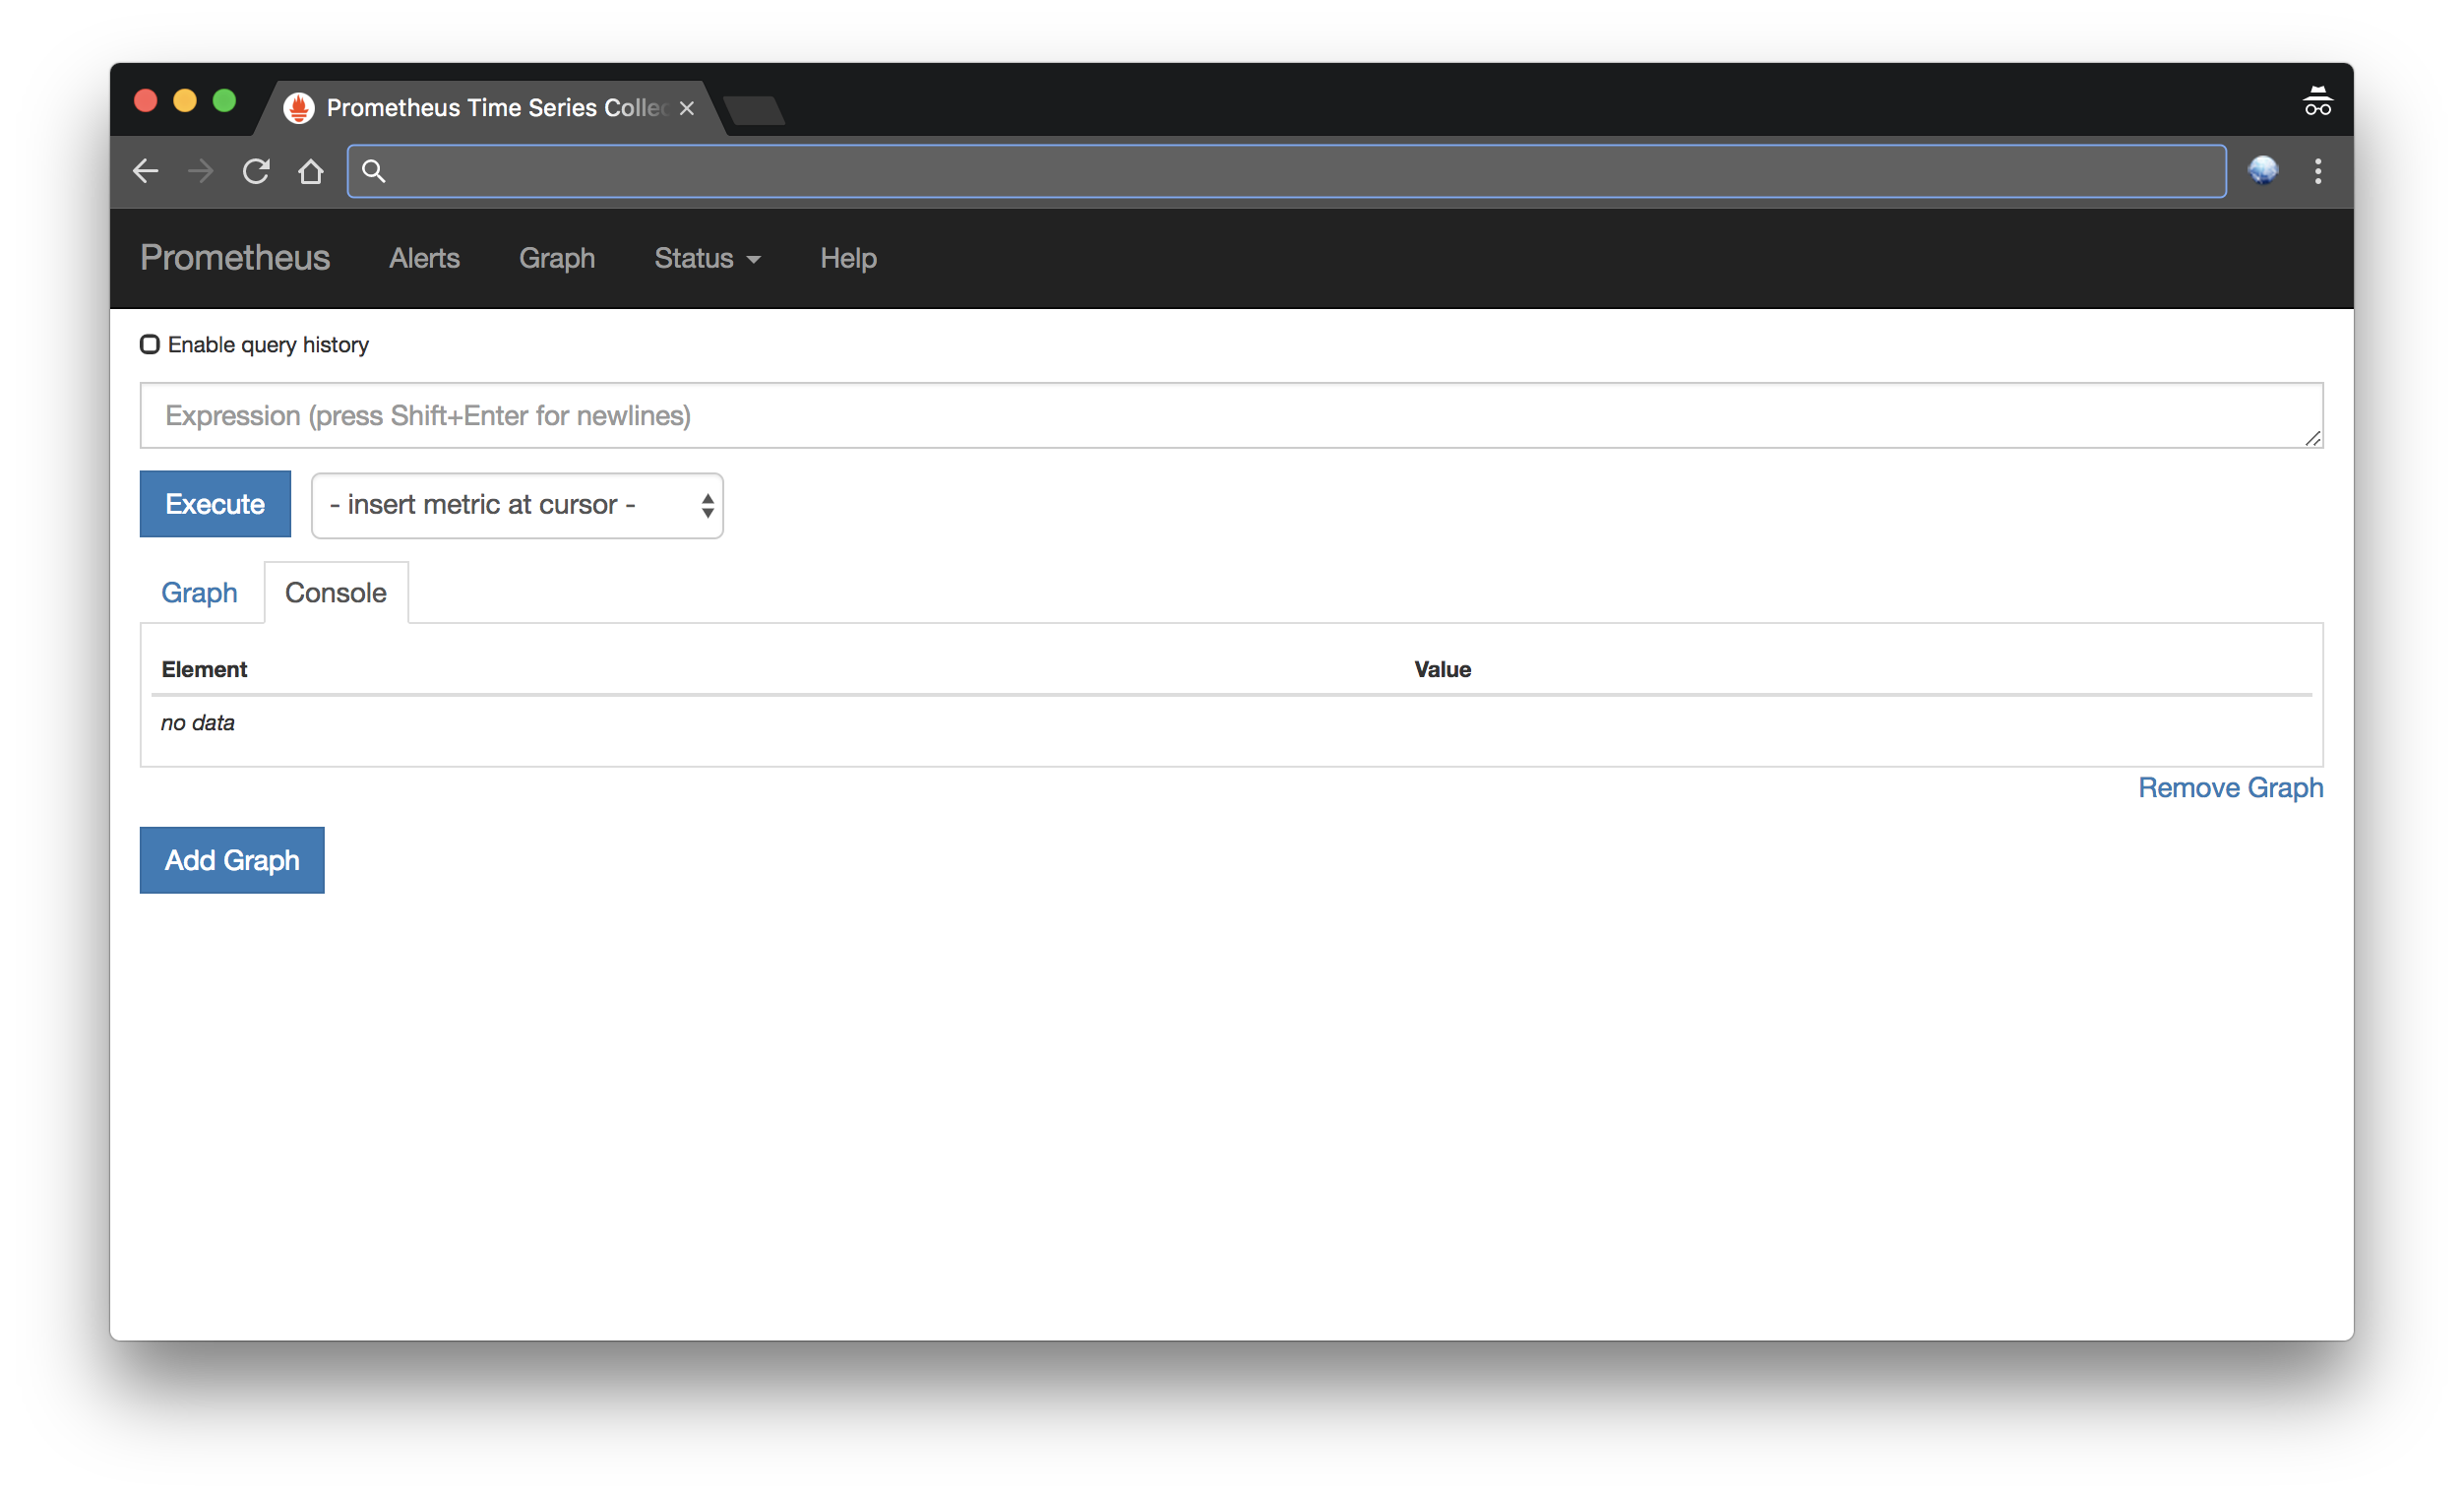
เสร็จแล้วรัน ./prometheus เพื่อเริ่มทำงาน แล้วเปิดไปดูที่ localhost:9090 จะได้หน้าเว็บสำหรับ Query ข้อมูล
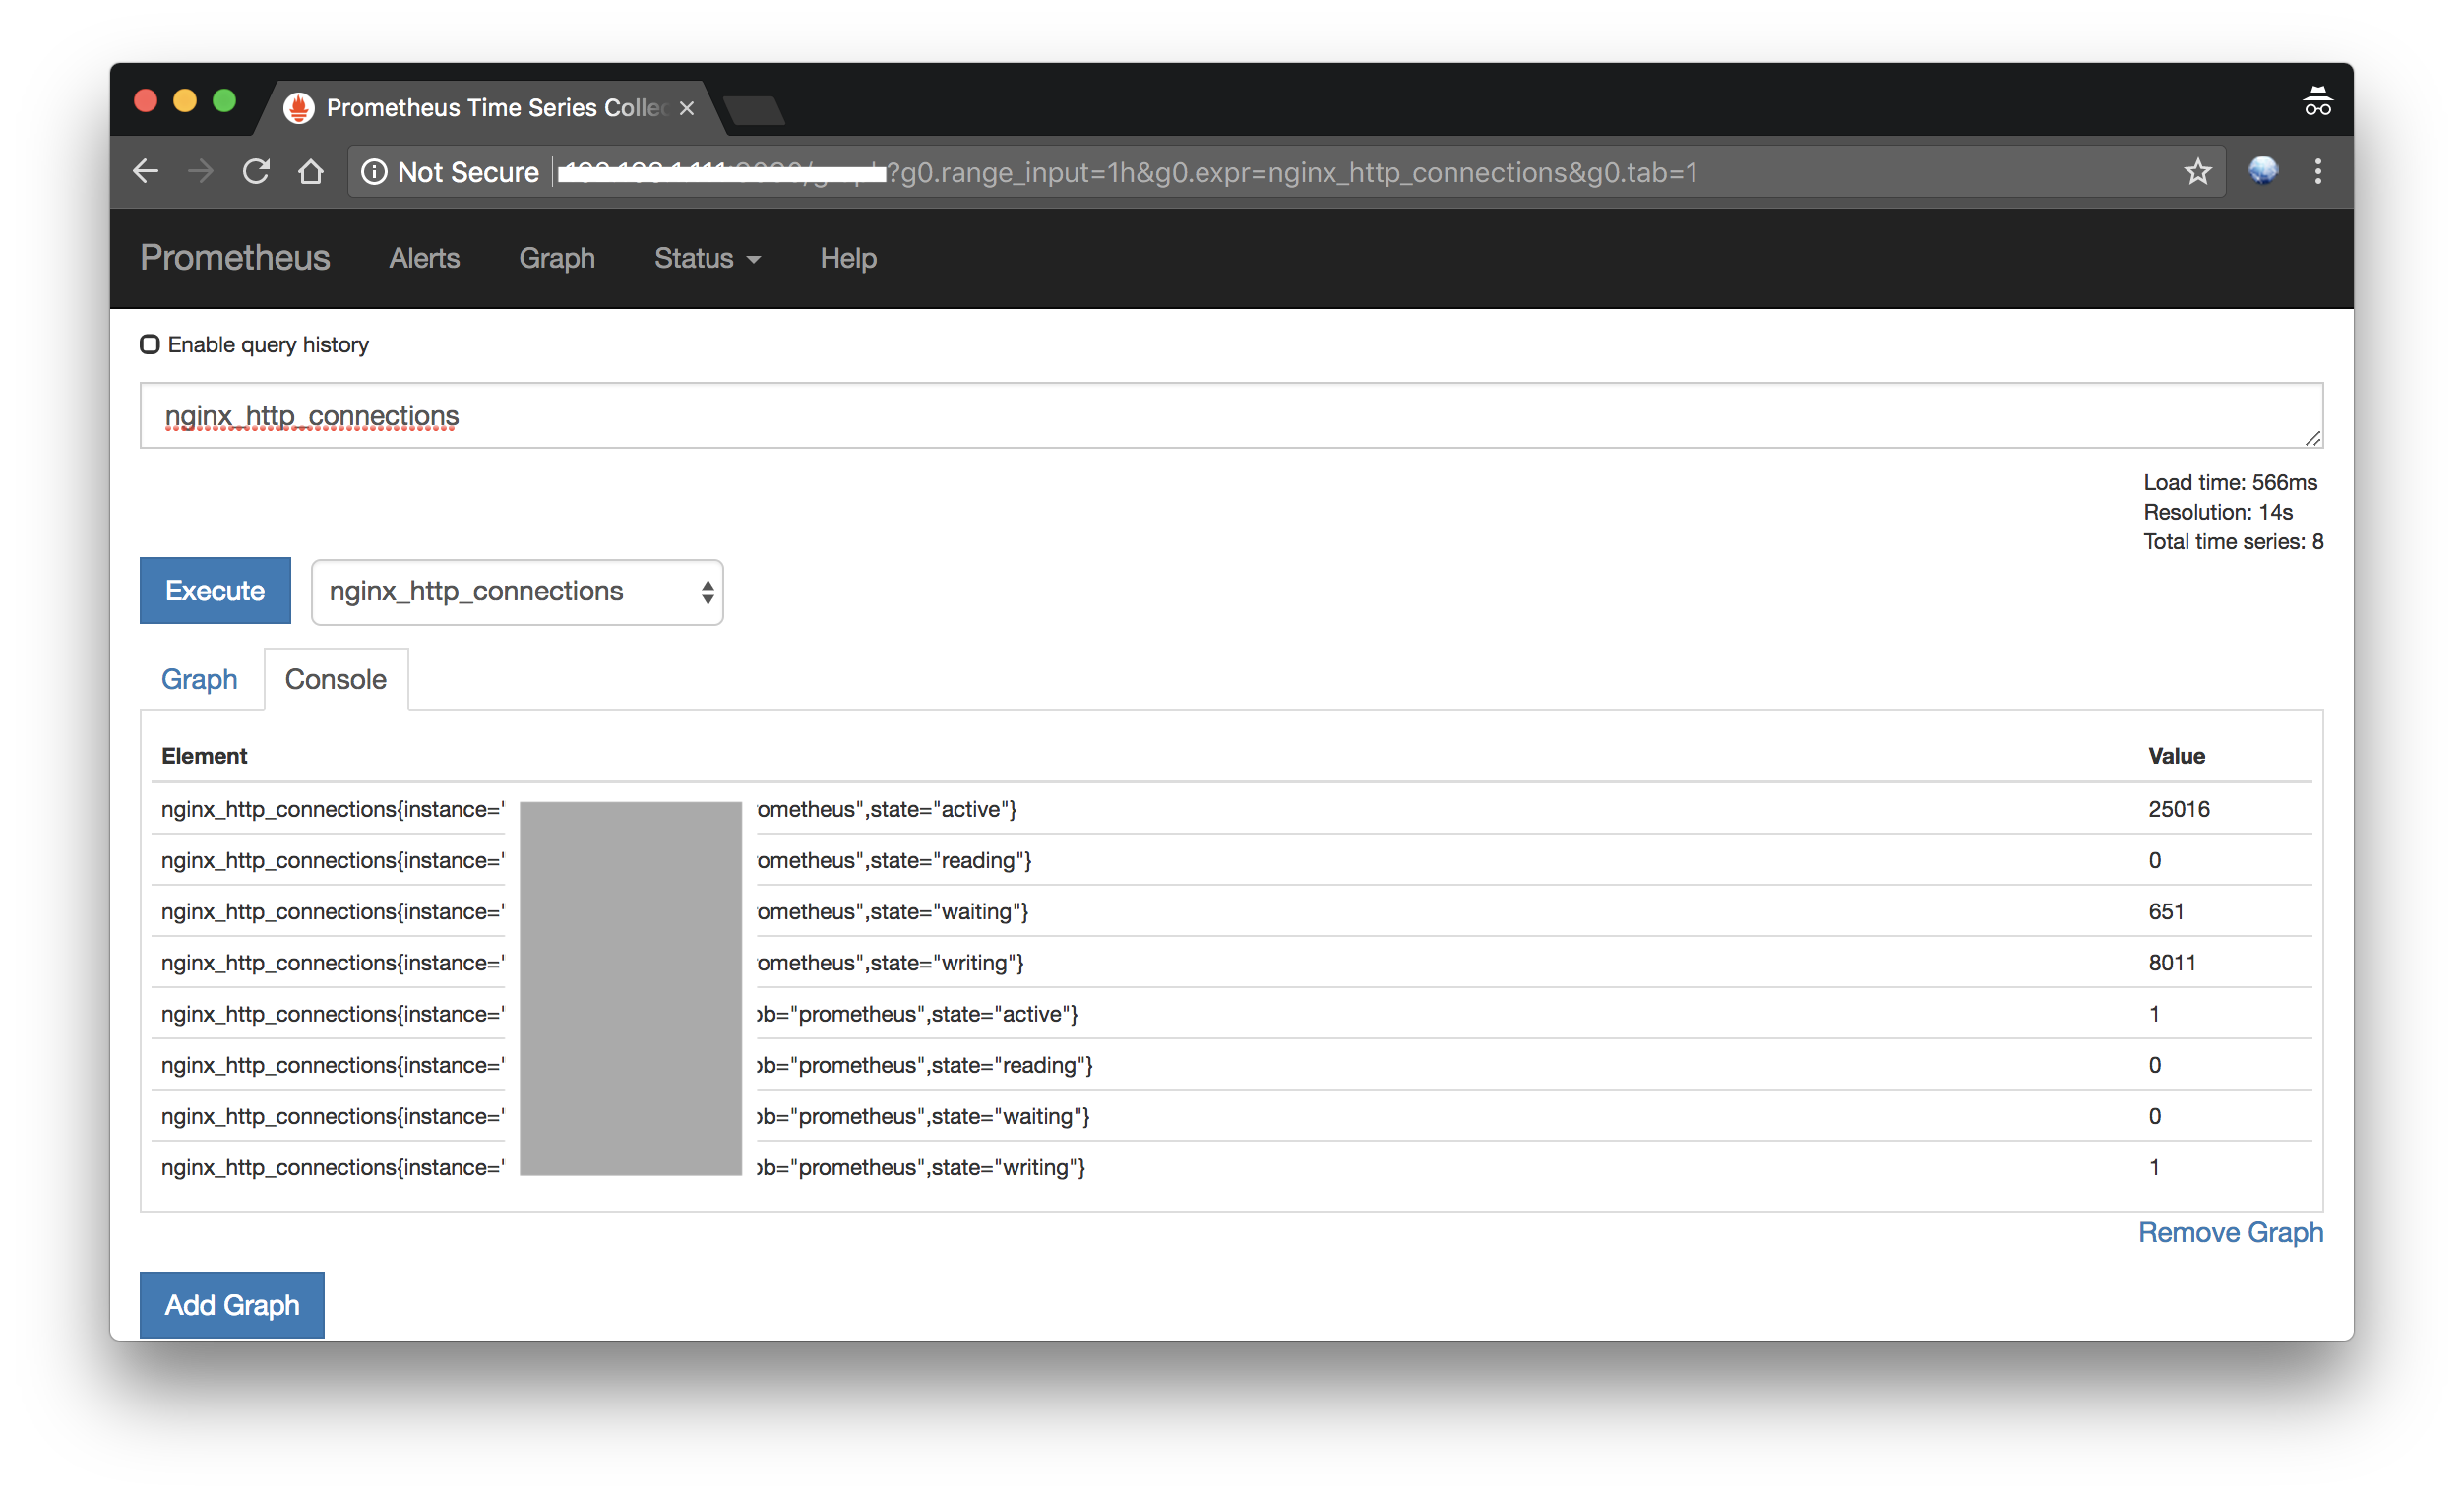
เลือก nginx_http_connections ก็จะได้ข้อมูล และสร้างกราฟได้
ต่อมาใช้ Grafana กัน
เอา docker รันขึ้นมาเลย
docker run -d --name=grafana -p 3000:3000 grafana/grafana
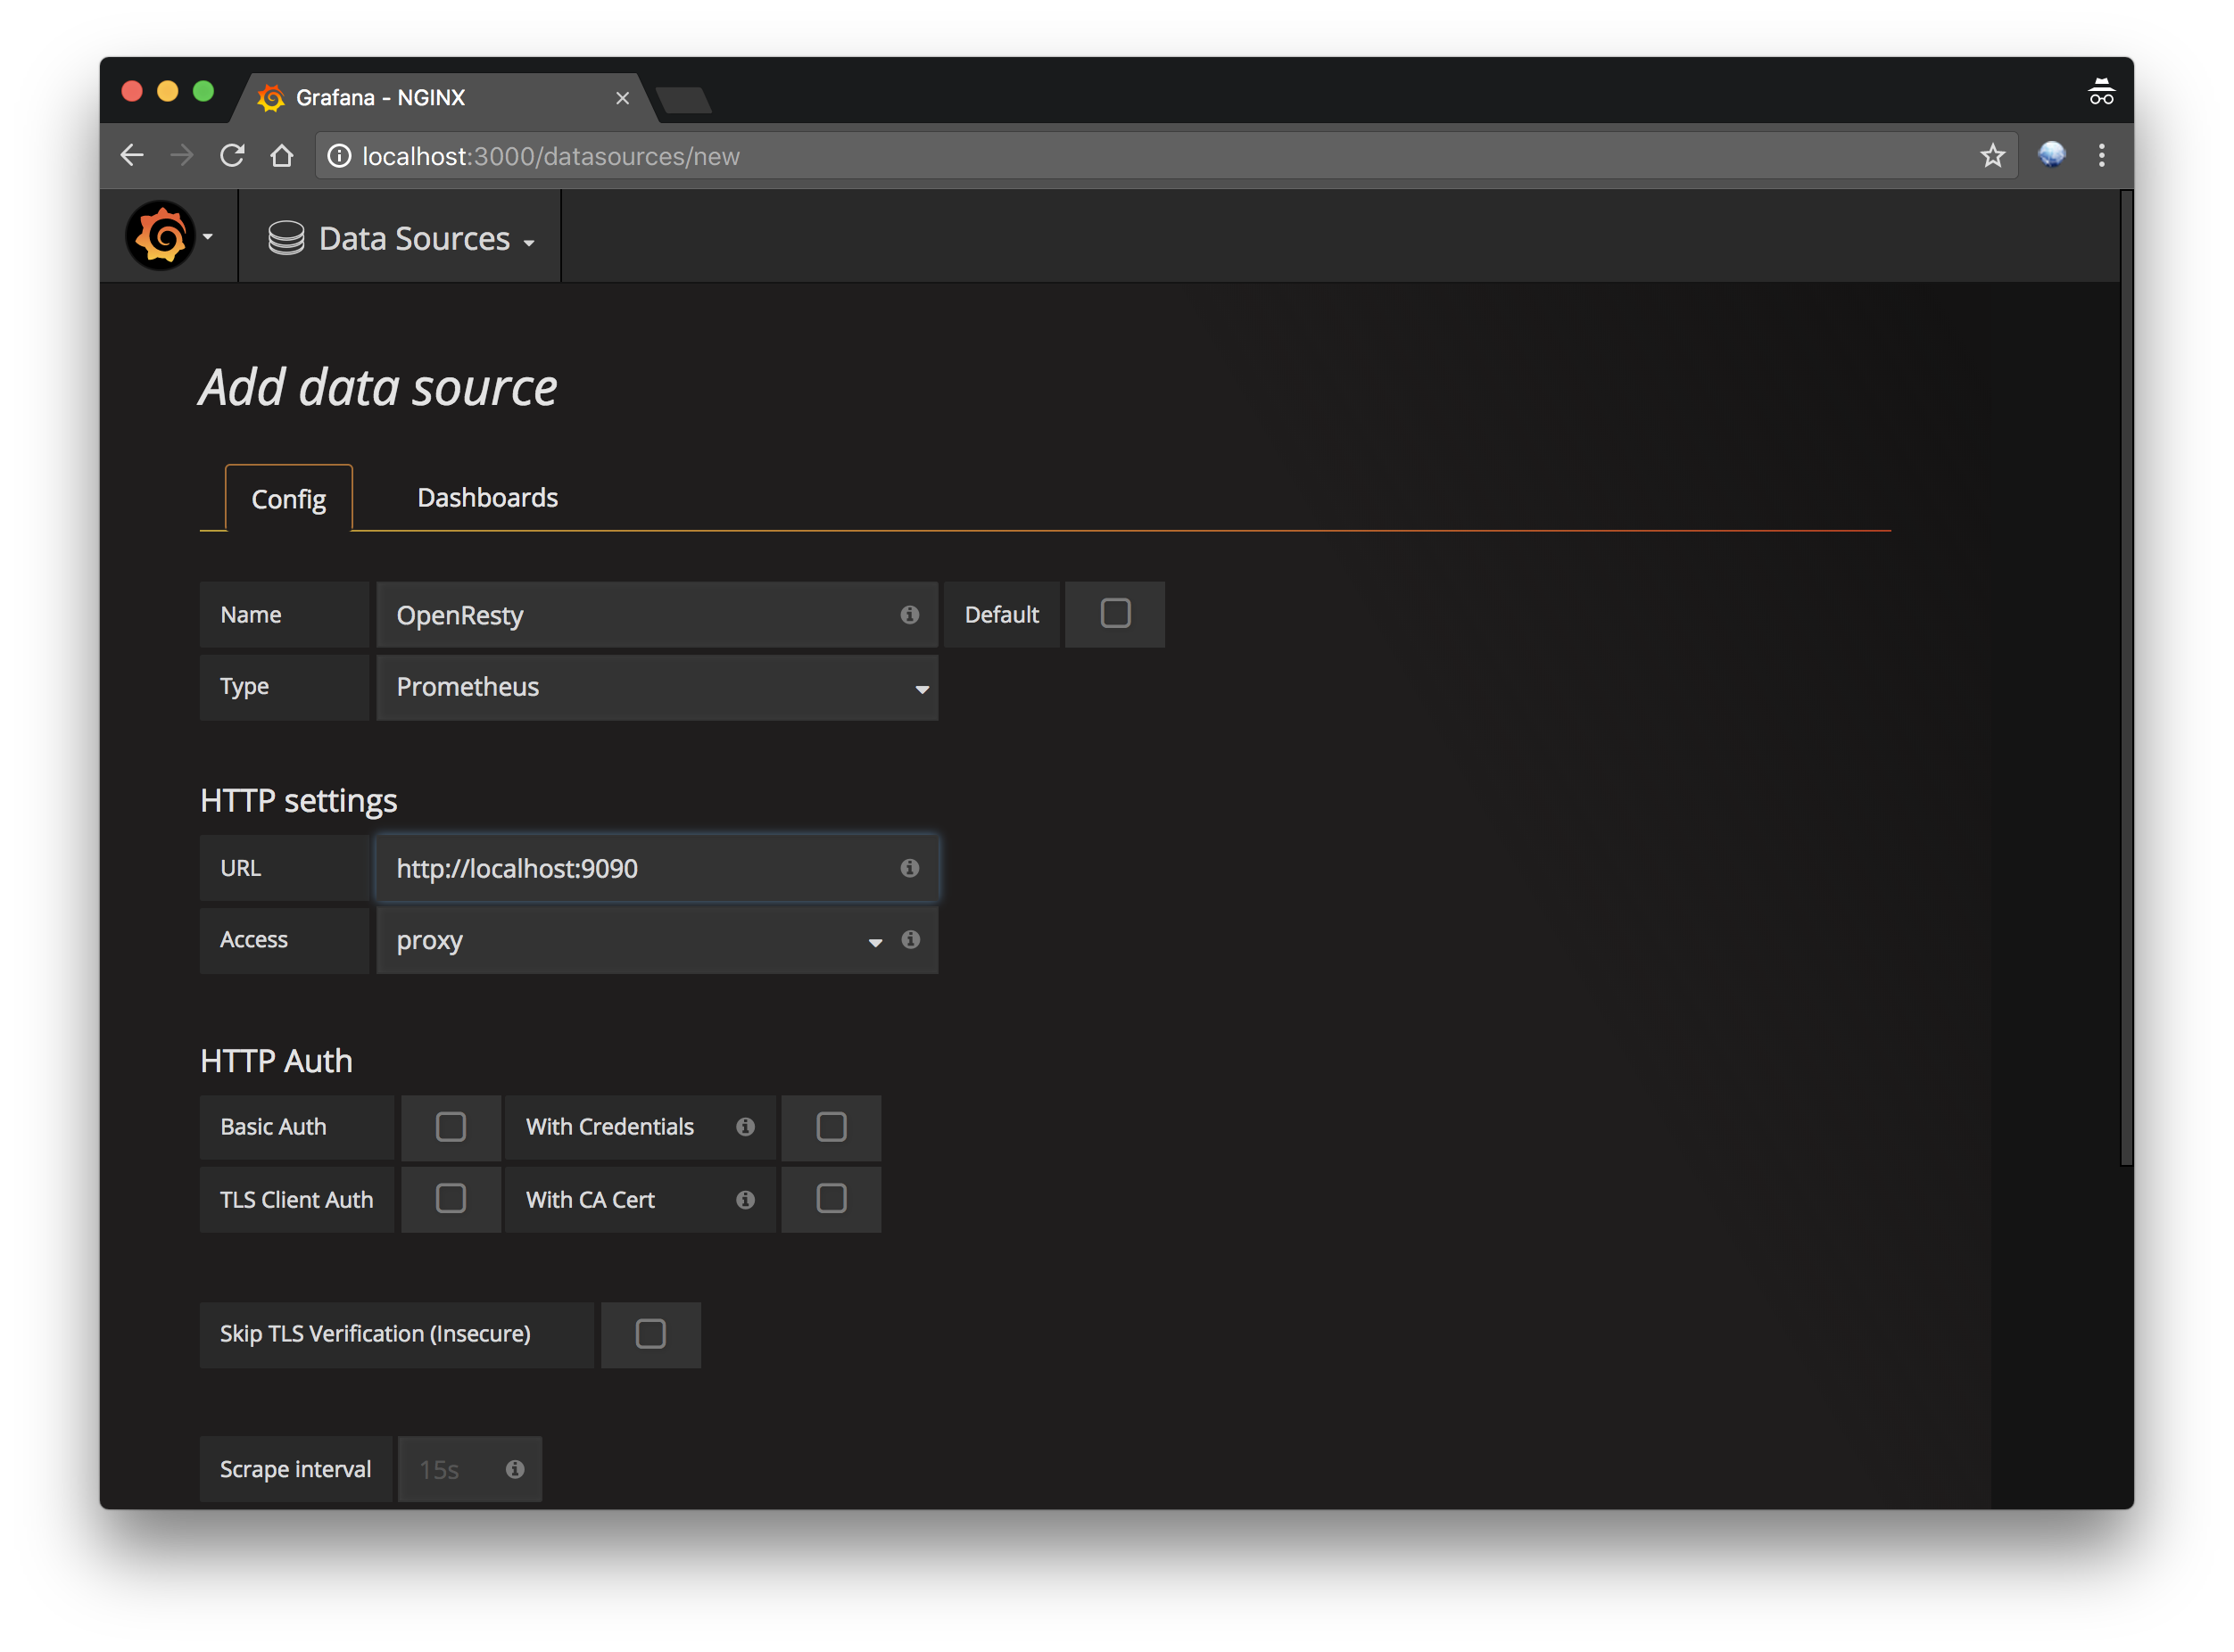
รันเสร็จ เปิดไปที่ http://localhost:3000 ใช้ Default username/password admin/admin แล้วไปตรง Datasource ใส่ URL ของ Prometheus ที่รันไว้
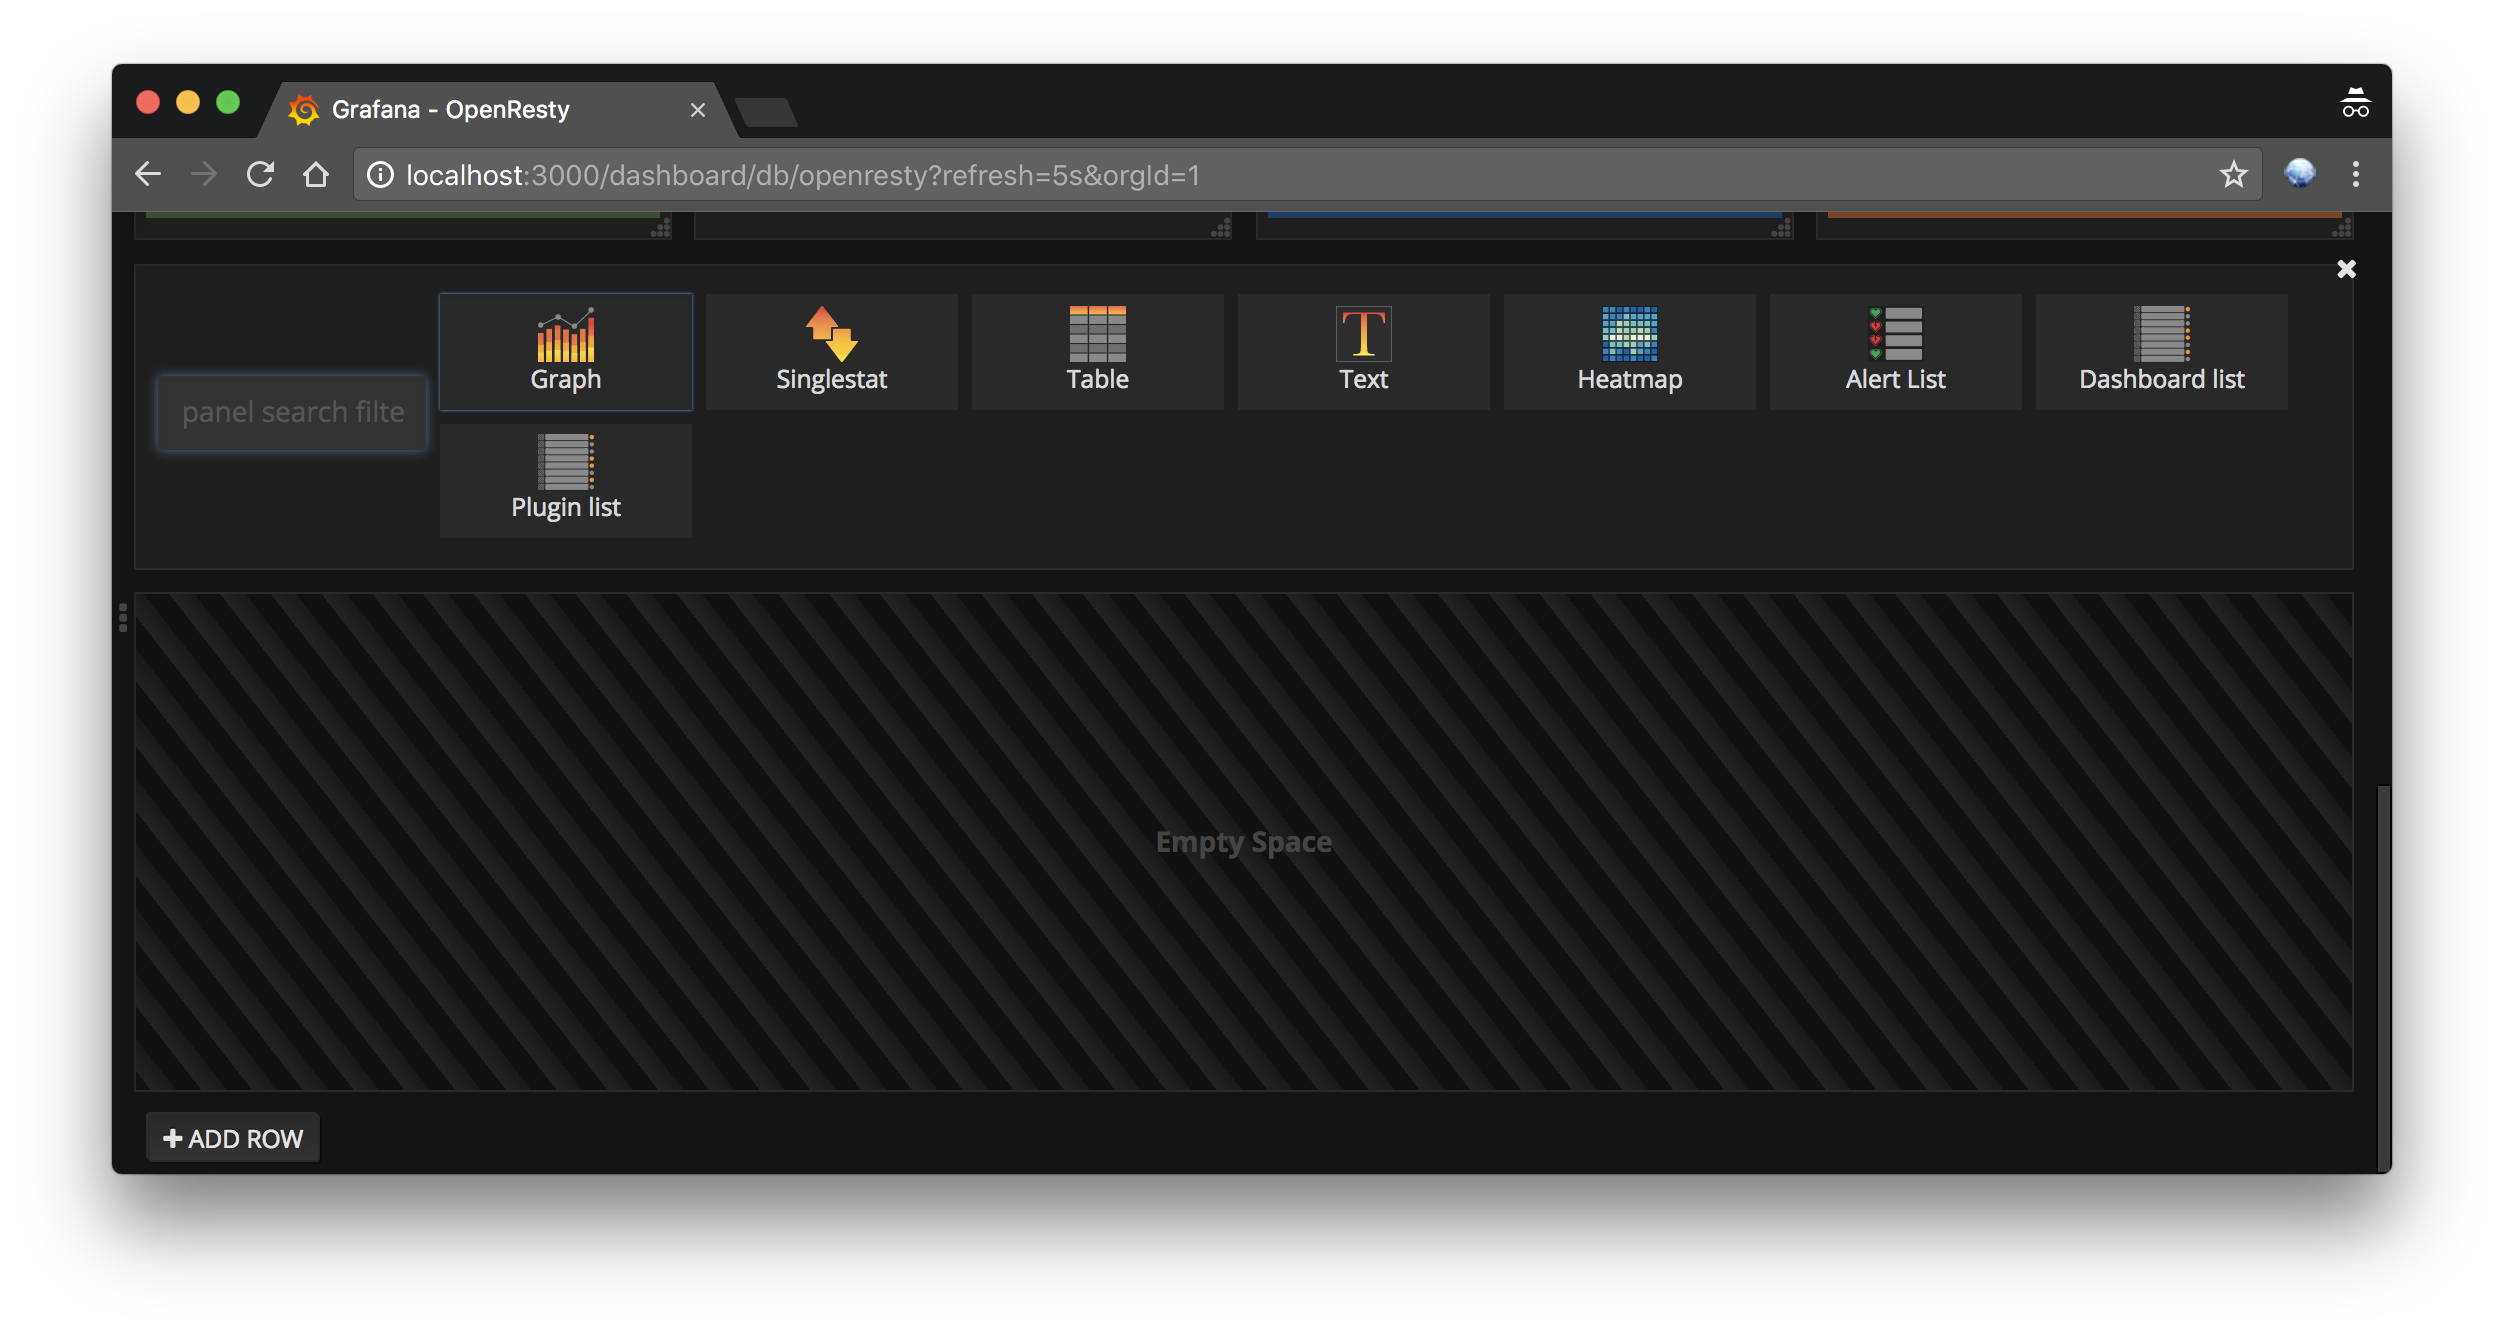
กดเซฟ แล้วไปสร้าง Dashboard กด Add Row เลือก Graph
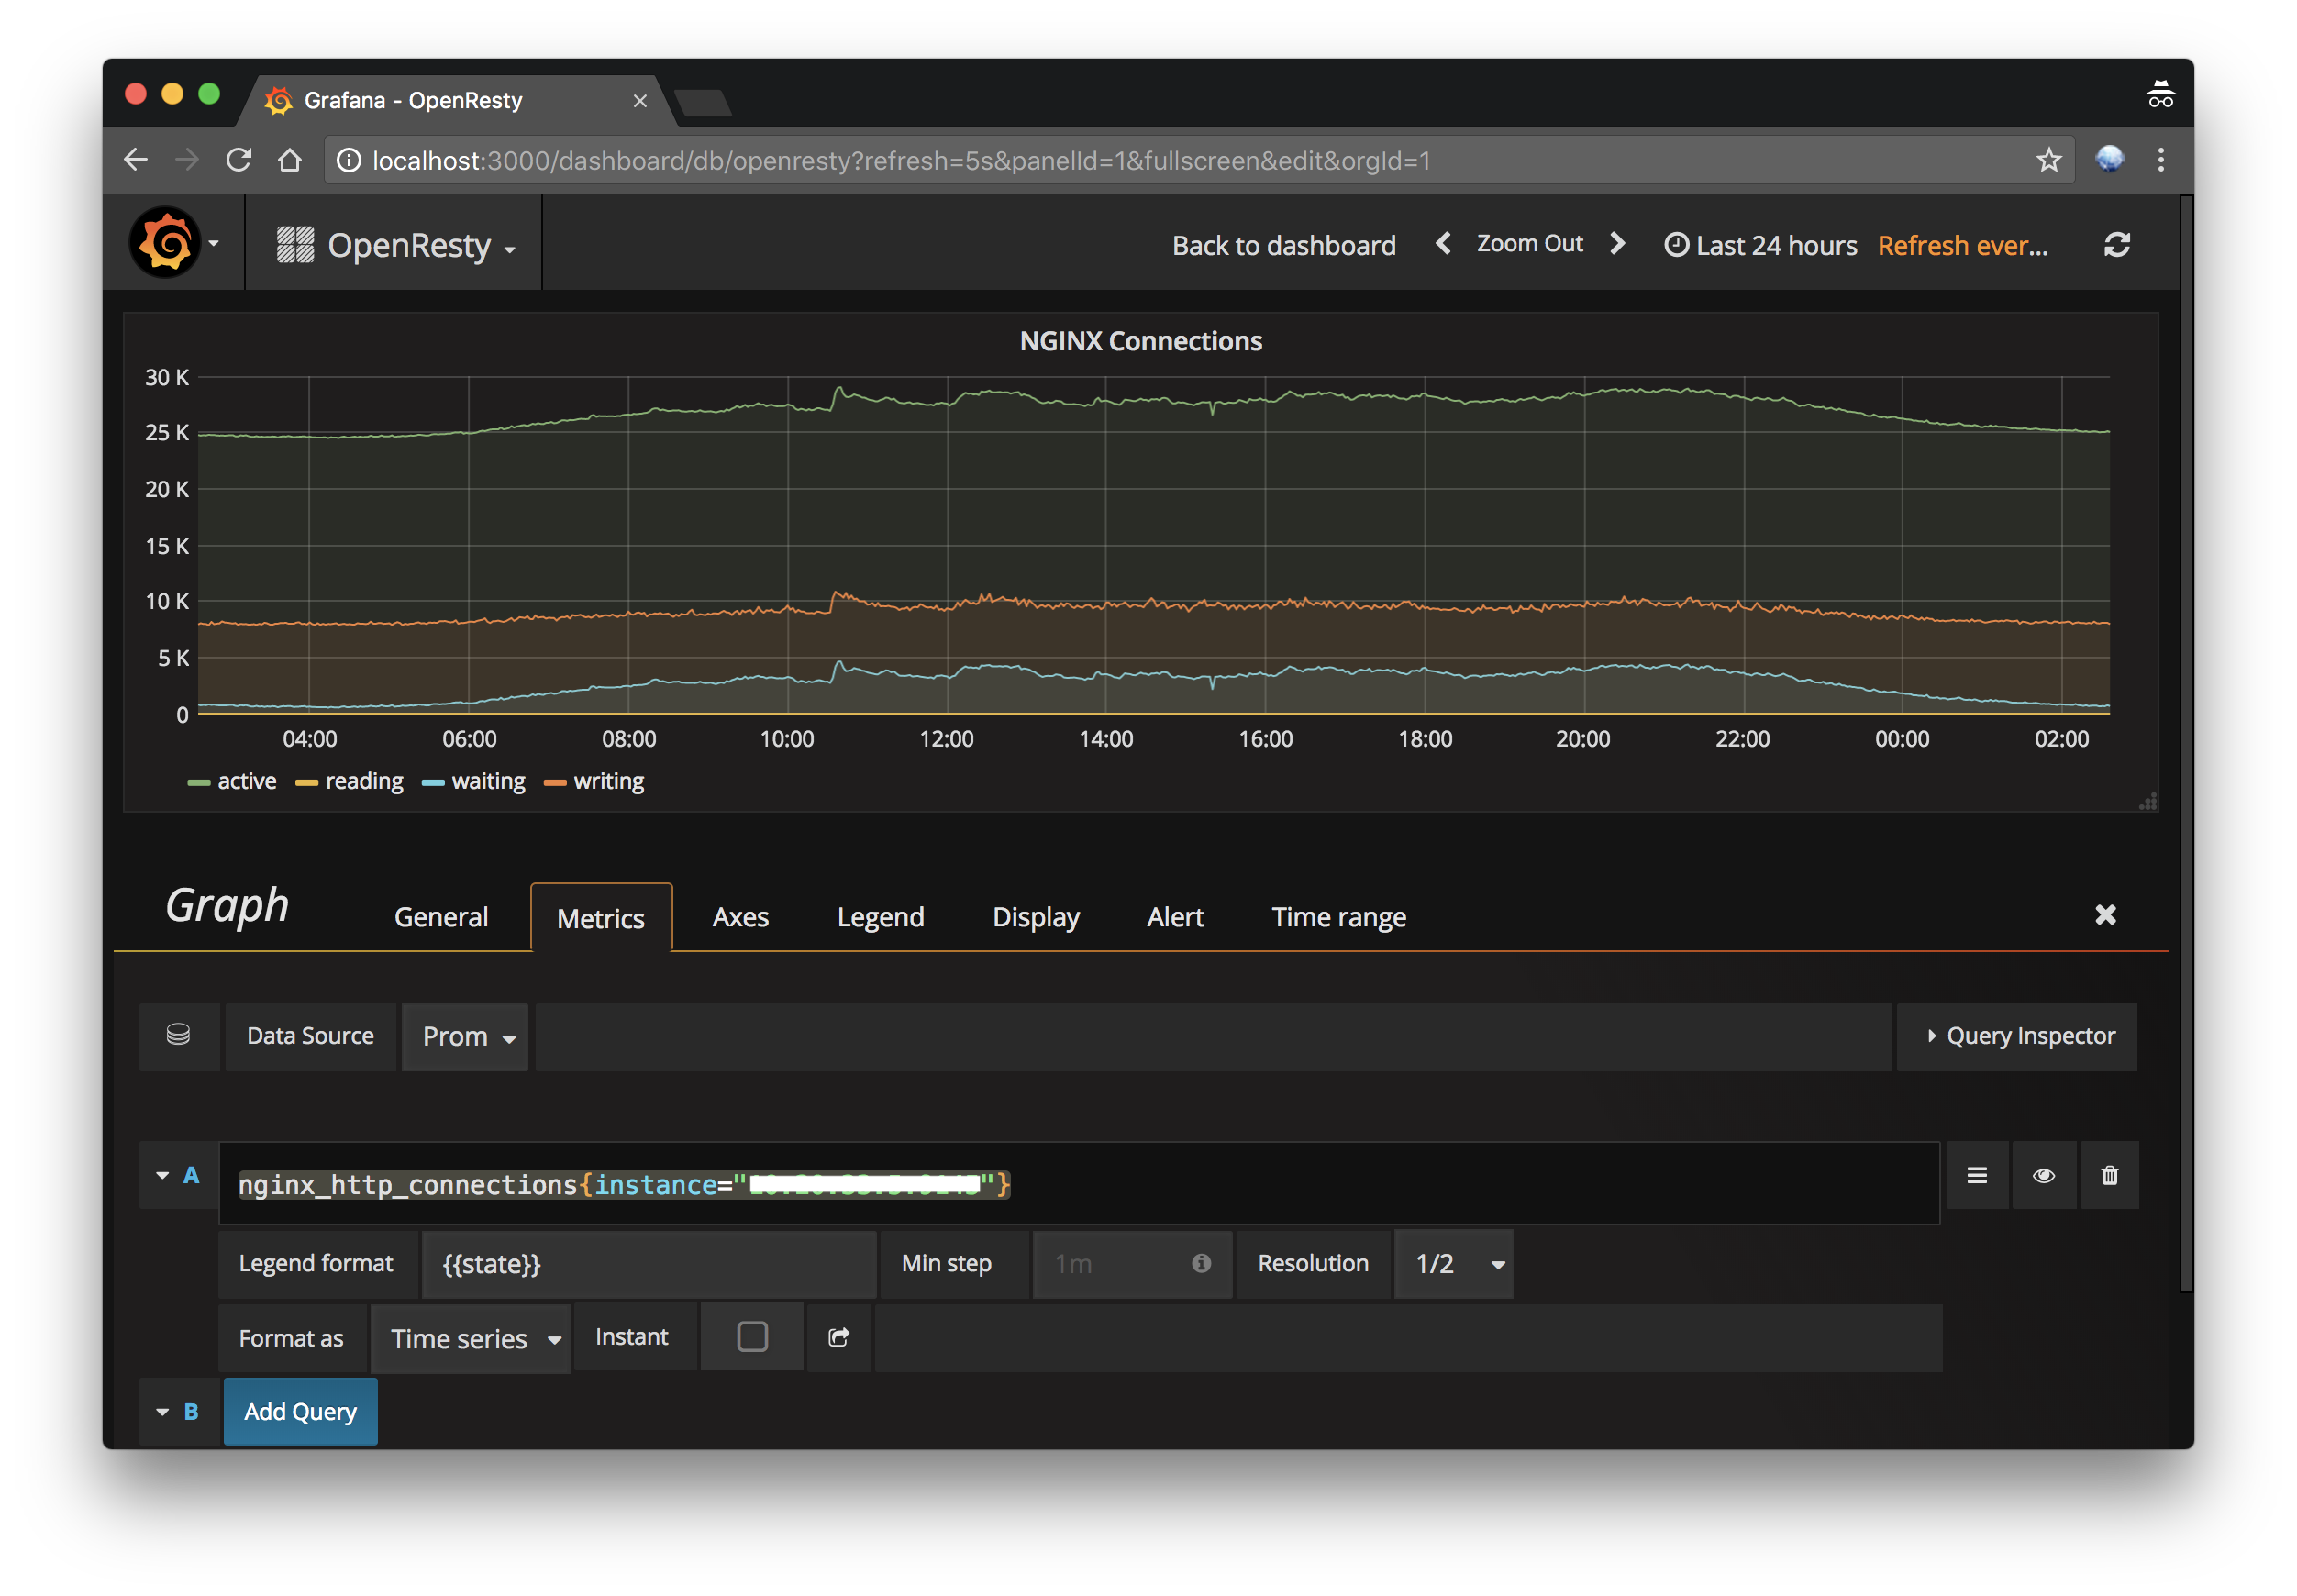
ในหน้าสร้างกราฟ เลือก Datasource และใส่ Query
nginx_http_connections{instance="IP:9527"}
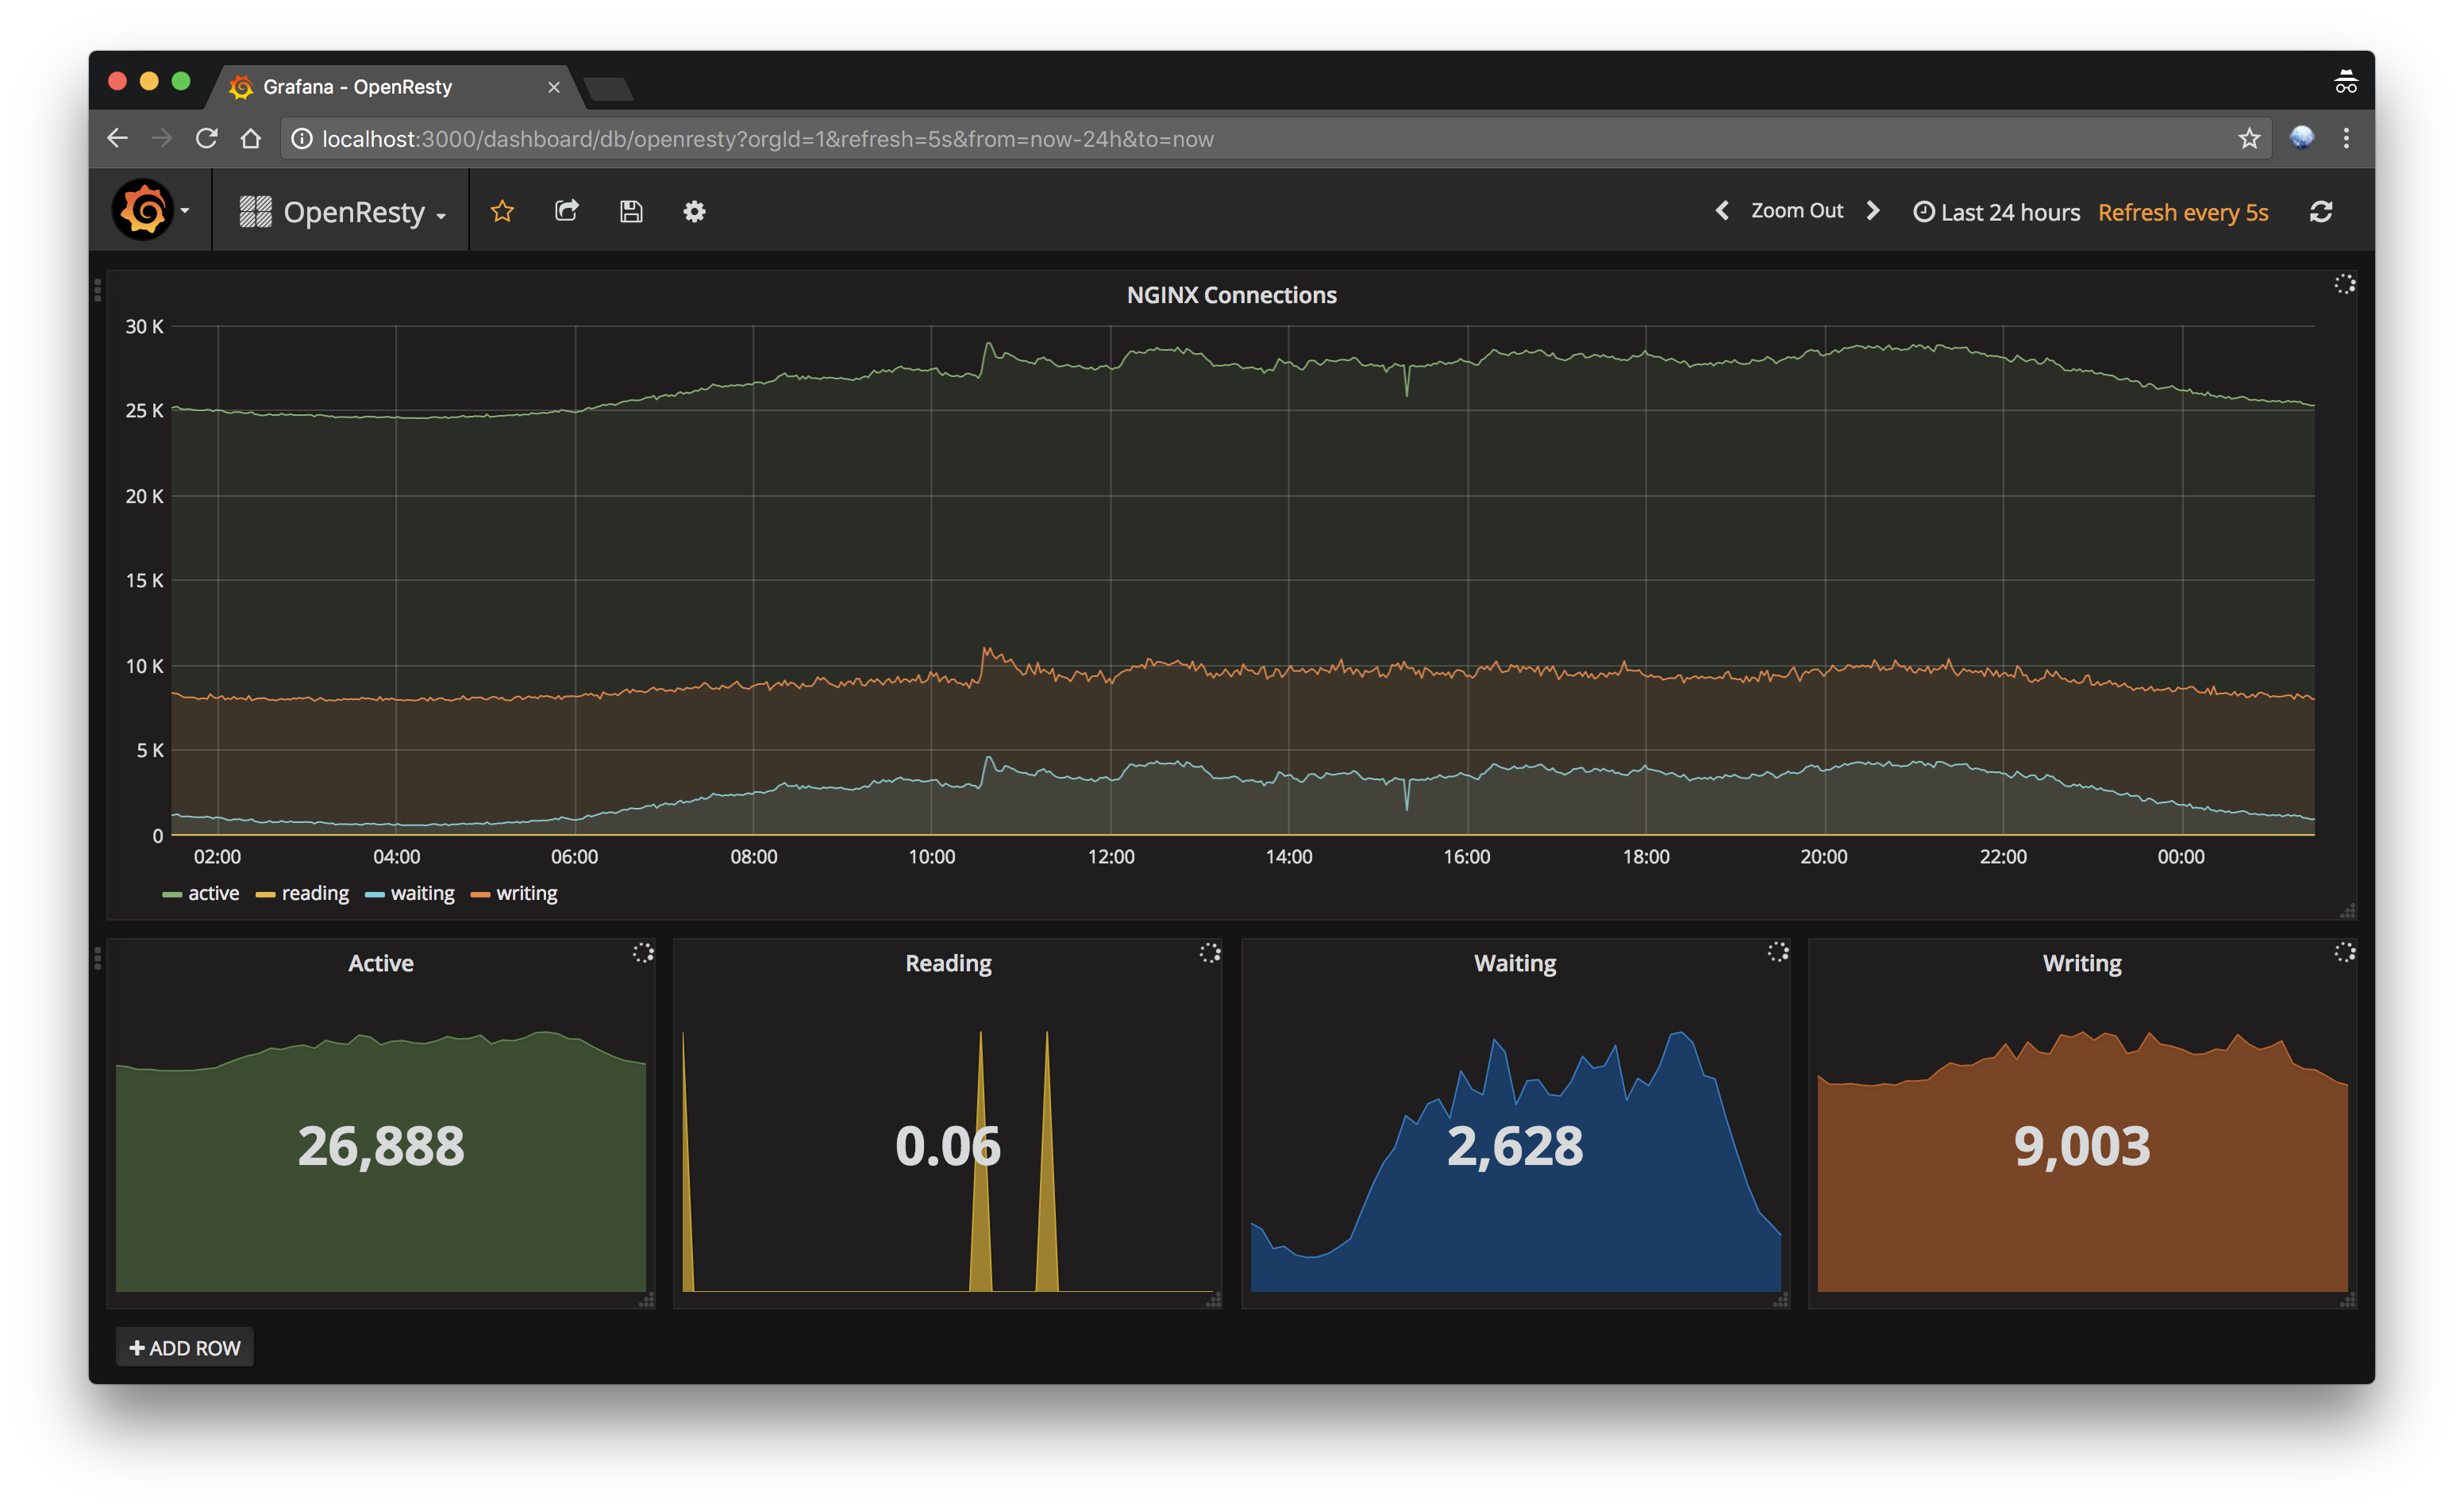
ต่อไปเพิ่มตัว Singlestat ใส่ Query
nginx_http_connections{instance="IP:9527", state="active"}
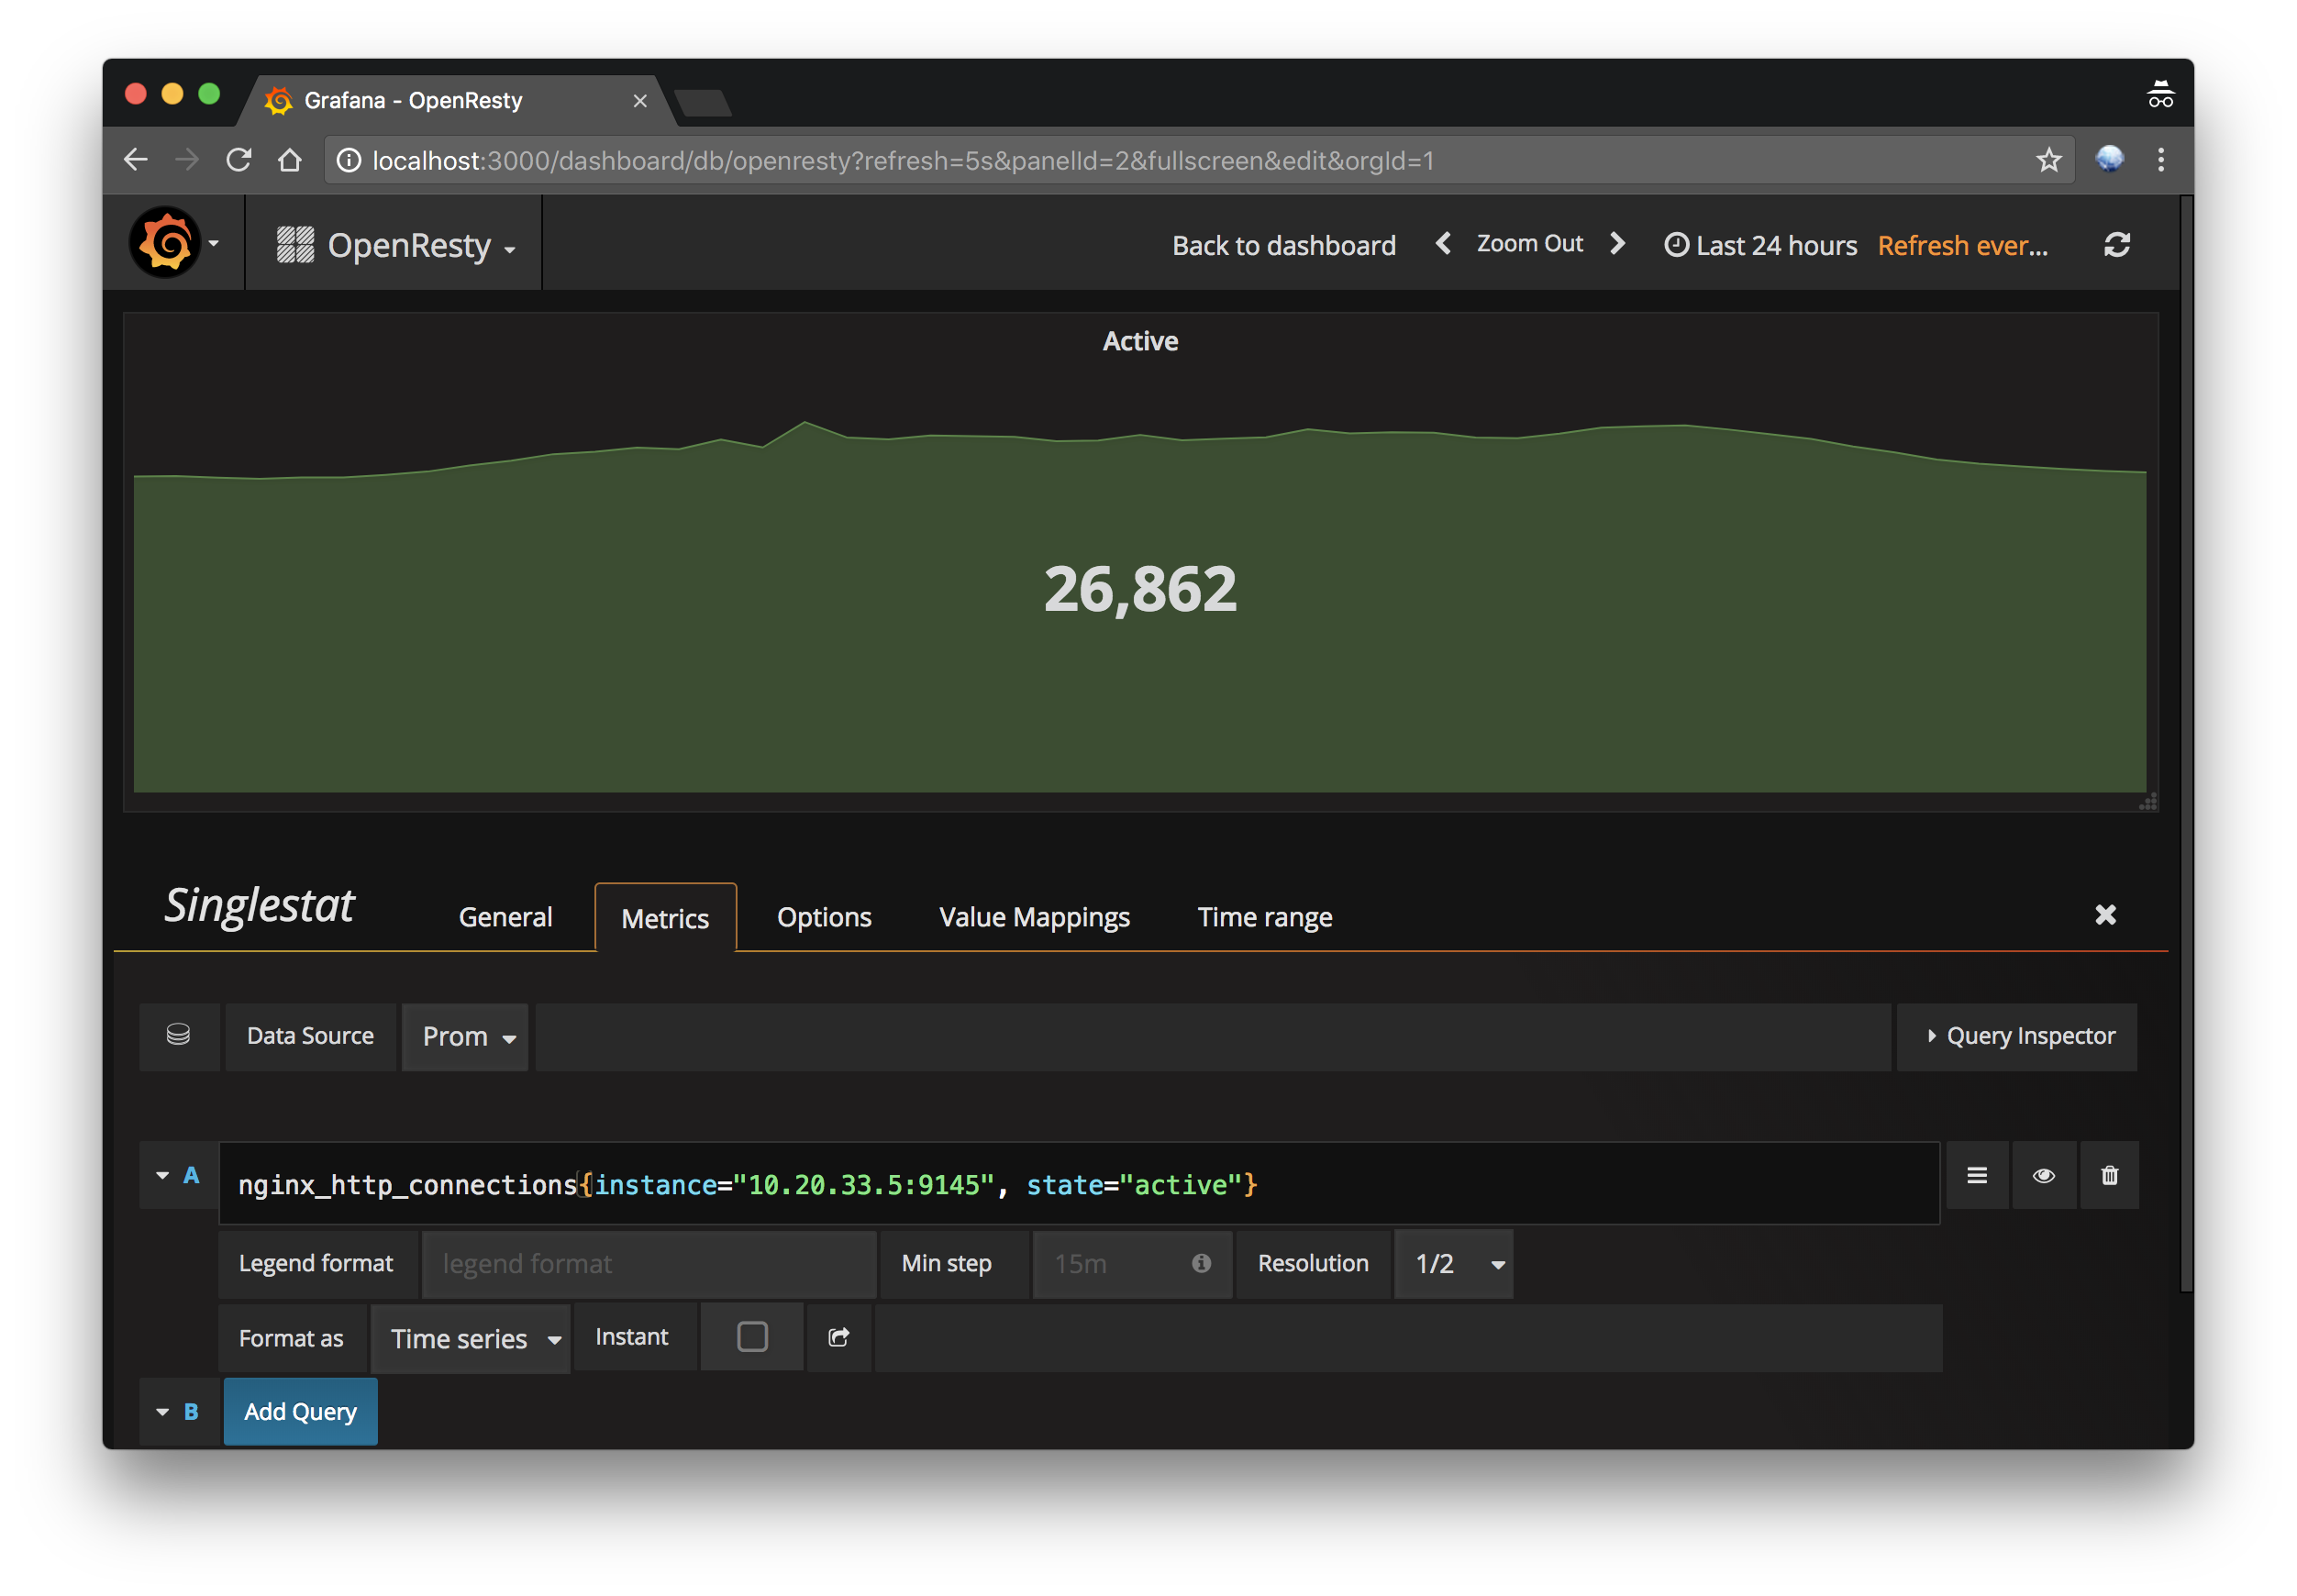
จะได้แบบนี้
จบ